B2B Marketing Framework

Most B2B marketing teams operate without a real framework. They have a list of channels (paid, content, events, email), a quarterly OKR document, and a marketing automation platform. What they don’t have is a system that connects company strategy to channel execution to measurable revenue outcomes.
The result is predictable. Marketing produces a lot of activity but cannot explain what is working. Sales complains about lead quality. The CFO asks why marketing spend keeps growing while pipeline doesn’t. The CMO presents a deck full of impressions and engagement metrics that nobody on the executive team trusts.
A B2B marketing framework solves this. It is the structure that connects who you sell to, what you say to them, where you reach them, and how you measure results. With it, every campaign has a reason to exist. Without it, marketing becomes a series of disconnected experiments that never compound.
This article covers the B2B marketing framework that actually works in 2026, the 6 layers that make it up, how to build it from scratch, and how to use it to run a marketing organization that produces predictable pipeline.
Key Takeaways
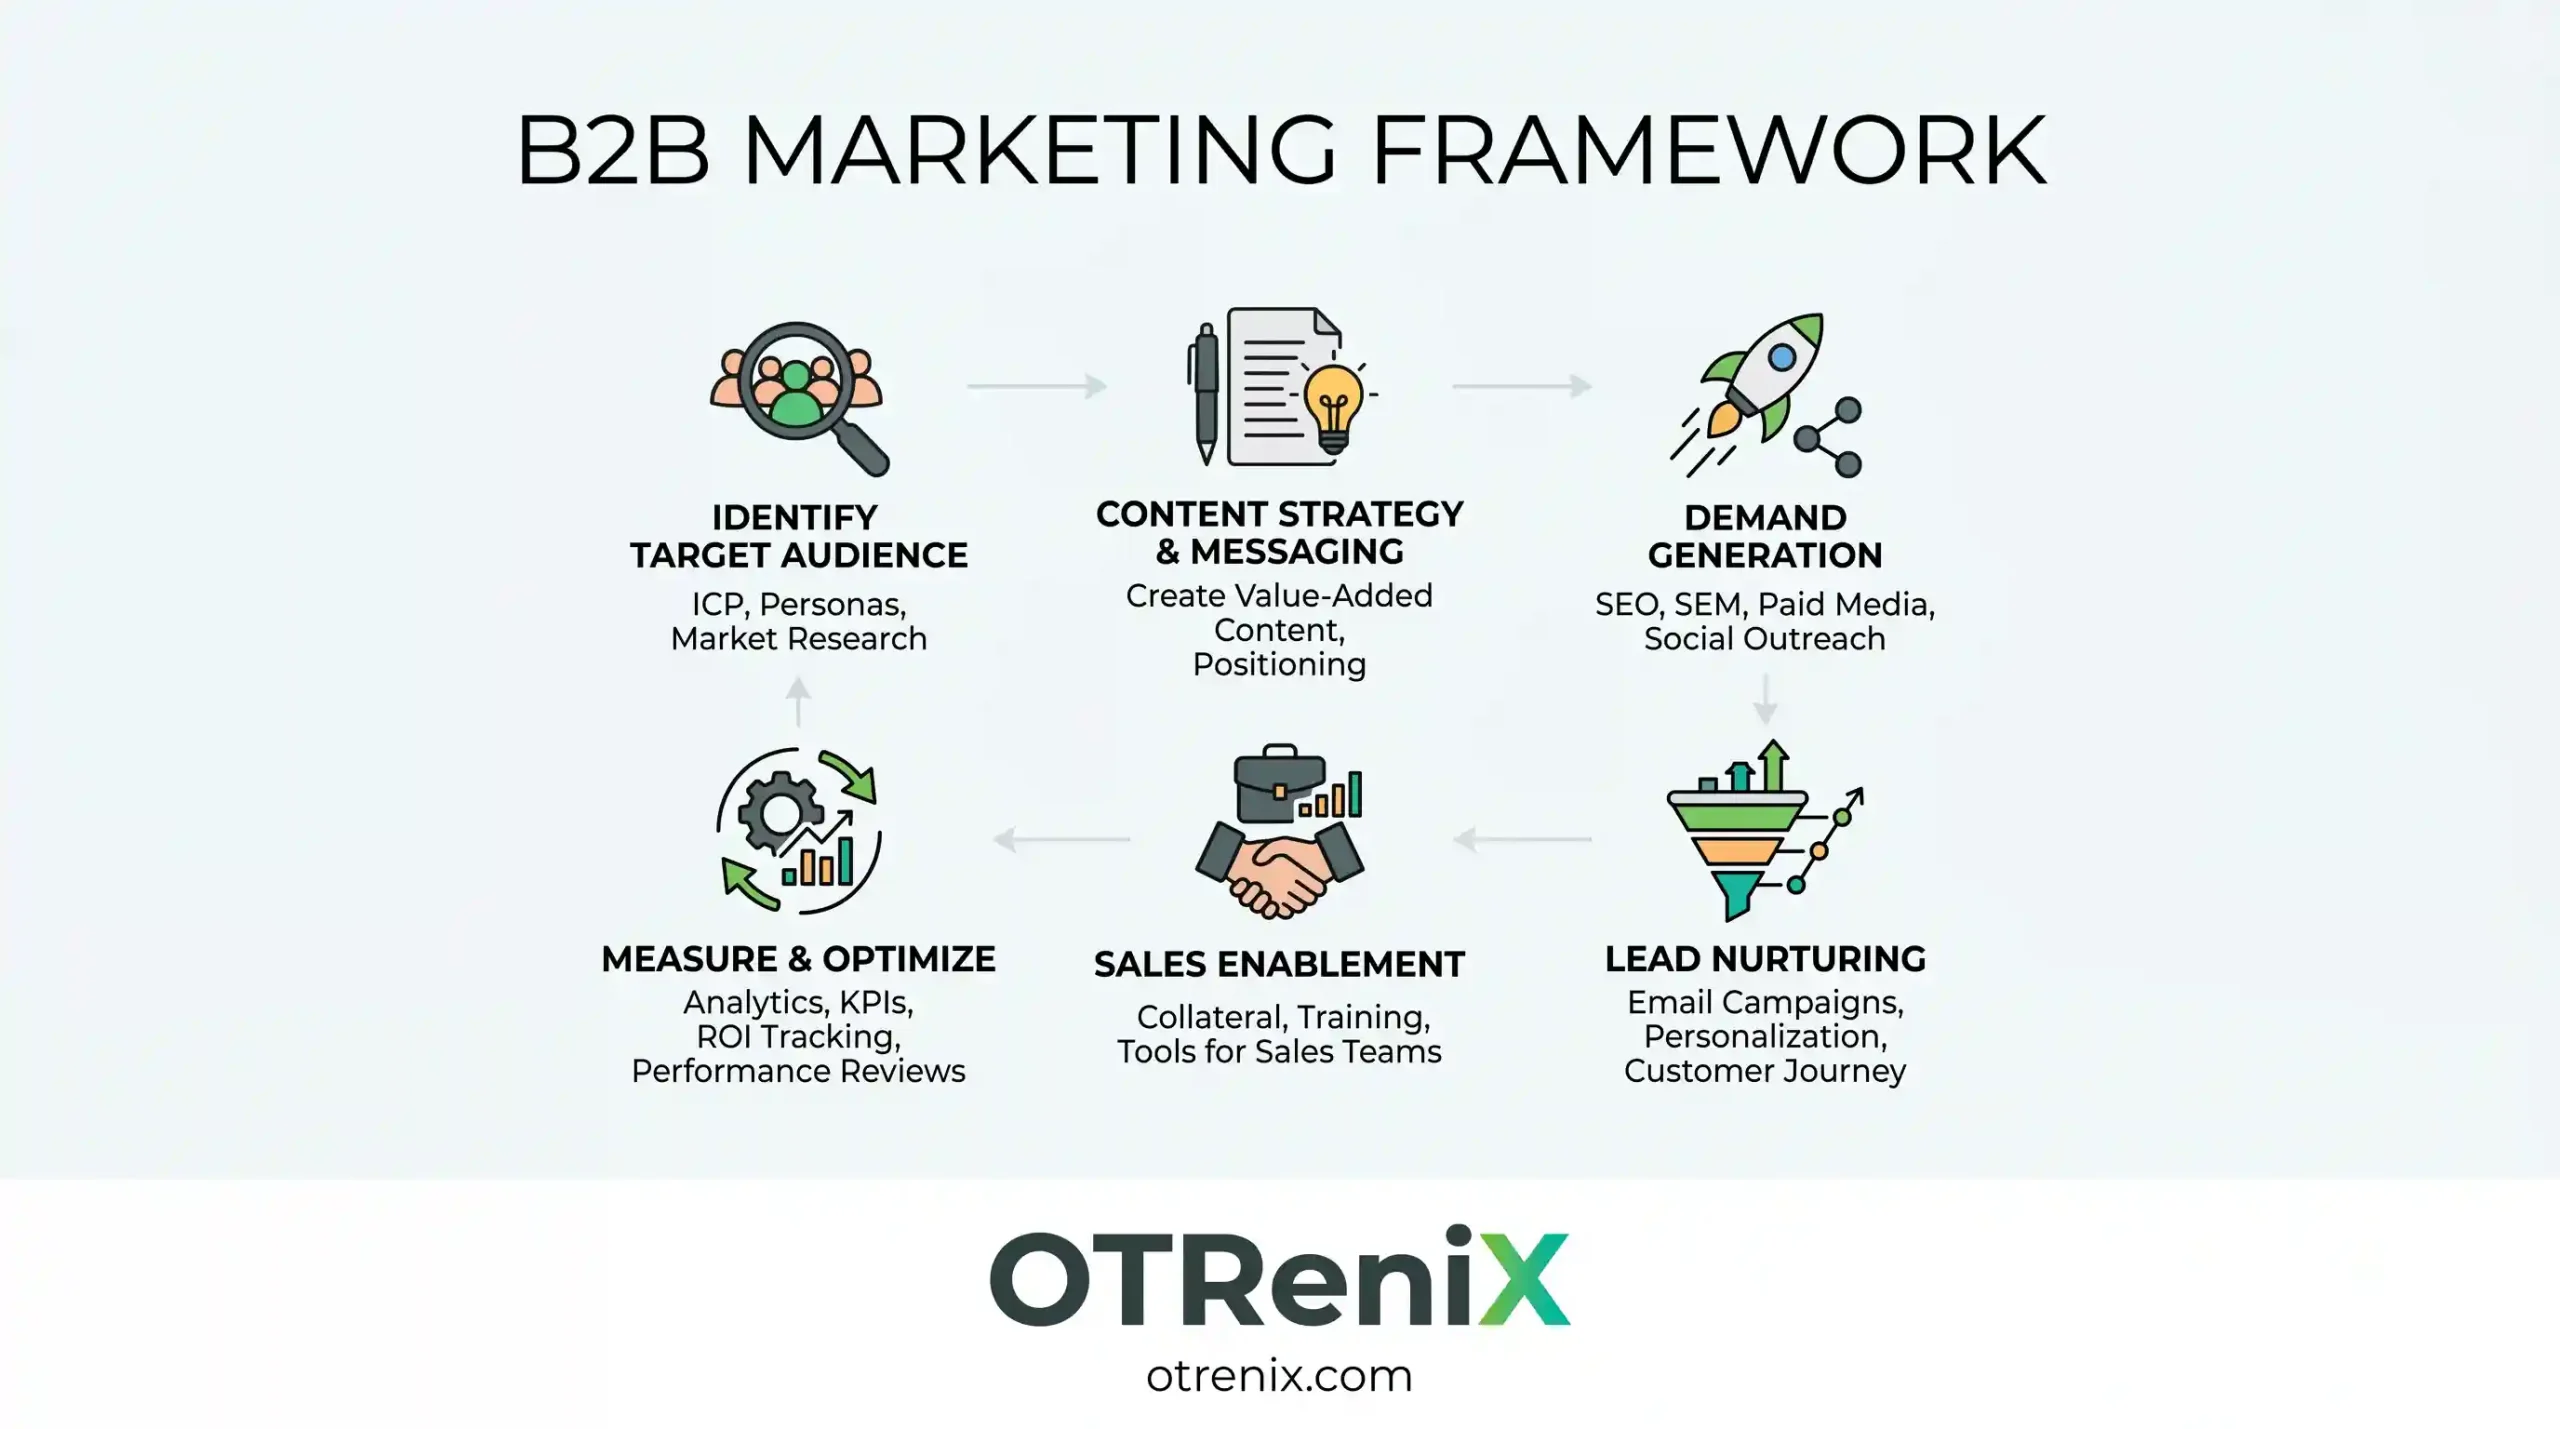
- A B2B marketing framework is a structured system connecting strategy to execution. It has 6 layers: ICP, positioning, demand strategy, channel mix, content engine, and measurement.
- Most B2B companies skip the upstream layers (ICP, positioning, strategy) and start with channels. This is why their marketing fails to compound.
- A working framework takes 6 to 12 weeks to build and 6 to 12 months to fully deploy. Companies that try to build it in 2 weeks end up with a slide deck, not a system.
- The framework should fit on 5 pages. If it takes 30, it is not a framework, it is a strategy document. Frameworks have to be usable in daily decisions.
- The right framework removes 30% to 50% of wasted marketing activity in the first year by clarifying which campaigns belong and which do not.
Why B2B Companies Need a Framework
A few specific problems show up in B2B marketing teams without a framework.
Disconnected channel work
The content team writes about features. The paid team buys keywords about competitors. The events team books speakers on industry trends. Each team is working hard, but the messages don’t reinforce each other. A prospect who sees 5 touchpoints from your company gets 5 different impressions of what you do.
Sales and marketing misalignment
Without a shared view of who the customer is and what to say to them, sales and marketing build their own versions. Marketing generates leads that look right on paper. Sales calls them and finds 80% are wrong. Each side blames the other.
Inability to scale spend
When marketing spend grows from $500K to $5M, channel choices and campaign decisions multiply. Without a framework to filter what belongs and what does not, the team makes random decisions and most of the new budget is wasted.
CFO skepticism
Marketing leaders without frameworks struggle to defend budgets in a CFO conversation. They cannot explain why specific spend choices were made, why one channel got more budget than another, or how marketing decisions tie to revenue. The framework is what makes that conversation possible.
Executive turnover
A new CMO who inherits a team without a framework usually rebuilds from scratch, losing 6 to 9 months of progress. With a framework, the new leader can refine the existing system instead of starting over.
The 6 Layer B2B Marketing Framework
A working framework has 6 layers stacked in order. Each layer answers a specific question and feeds the layer below.
| Layer | Question it answers | Output |
|---|---|---|
| 1. ICP | Who do we sell to? | Defined ideal customer profile and personas |
| 2. Positioning | Why do they buy from us? | Positioning statement, messaging framework |
| 3. Demand strategy | How do we reach them? | Channel priorities, demand model |
| 4. Channel mix | Where exactly do we spend? | Budget allocation, campaign portfolio |
| 5. Content engine | What do we say at each stage? | Content map, asset library, editorial plan |
| 6. Measurement | How do we know it’s working? | KPIs, reporting cadence, attribution model |
Skipping any layer breaks the system. Most B2B companies start at layer 4 or 5 because that is where the visible work happens, and the result is the disconnected execution described above.
Layer 1: Ideal Customer Profile
The ICP is the foundation. It defines the specific accounts and people most likely to buy, expand, and refer your product. Without a clear ICP, every other layer is built on guessing.
The 4 components of a strong ICP
A complete ICP has 4 dimensions:
- Firmographics: company size, industry, geography, business model. These define the type of company.
- Technographics: tech stack, current vendors, integrations. These define readiness to buy and compatibility.
- Trigger events: new CISO hired, recent breach, new compliance requirement, funding round, expansion into new market. These define when a prospect is most likely to engage.
- Persona detail: named buying roles within the account, their priorities, their pain points, their typical objections. These define how to communicate.
A typical ICP statement looks like this: “Mid market healthcare organizations with 500 to 5,000 employees in the United States, currently using legacy SIEM, that have recently hired a new CISO or experienced a HIPAA audit finding within the past 12 months. The economic buyer is the CISO. The technical buyer is the SecOps lead. The user is the security analyst.”
This is precise enough to make decisions. “Mid market companies that need security” is not.
How to build an ICP
The work takes 4 to 6 weeks. Start by analyzing your existing customer base. Pull data on your top 20 customers and your worst 20 customers. Compare across firmographics, technographics, and account size. The patterns will be clear within a week.
Then interview 10 to 15 customers. Ask why they bought, what alternatives they considered, what triggered the search, who was on the buying committee, and what almost killed the deal. Patterns from interviews show the buying journey, which a database analysis cannot.
Finally, validate with sales. The ICP must reflect deals that sales actually closes, not the deals marketing wishes they had. If sales says “we never close those deals,” the ICP needs revision.
When to revisit the ICP
Most companies should revisit the ICP every 12 to 18 months. Sooner if you launch new products, expand into new segments, or see major changes in close rates. The ICP is not a one time deliverable. It is a living document.
Layer 2: Positioning
Positioning answers the question: why do customers in your ICP buy from you instead of the alternatives? It is the most underdeveloped layer in most B2B marketing frameworks.
The 5 elements of positioning
A clear positioning statement has 5 components:
- Market category: the existing or new category you compete in
- Target customer: the segment you serve, drawn from the ICP
- Key alternative: what they would do without you (a competitor, an in house solution, doing nothing)
- Unique value: what you deliver that the alternatives don’t
- Proof: the evidence that supports your unique value
A useful positioning statement looks like this: “For mid market healthcare CISOs evaluating SIEM replacement, [Company] is the first cloud native SIEM purpose built for HIPAA environments. Unlike Splunk and traditional SIEMs, we deploy in 7 days and produce audit ready reports out of the box. Our 200+ healthcare customers have reduced audit prep time by 70%.”
This statement makes every other marketing decision clearer. It tells you which keywords to bid on, which industries to target, which case studies to write, and which competitors to compare against.
Common positioning mistakes
The 3 mistakes that break most B2B positioning:
- Trying to serve everyone. A positioning statement that lists 5 industries and 4 personas is not a positioning statement. It is a list. Pick a primary segment.
- Listing features instead of differentiation. Features describe what you do. Positioning describes why customers should choose you over alternatives. They are different.
- Avoiding competitive comparison. Positioning that does not name what customers would do without you is incomplete. The alternative is always part of the decision, even if you do not name it.
How positioning connects to the rest of the framework
Positioning is the bridge between strategy and execution. The ICP defines who you sell to. Positioning defines what you say to them. Every channel, every campaign, and every piece of content should be a direct expression of the positioning. If a piece of content cannot be traced back to the positioning statement, it does not belong in the system.
Layer 3: Demand Strategy
Demand strategy is the model that explains how prospects discover, evaluate, and choose your product. It is the layer that connects positioning to channel decisions.
The 3 demand modes
B2B demand strategy in 2026 operates across 3 modes:
- Demand creation: building awareness with prospects who do not yet know they have a problem. Content, thought leadership, brand, and category creation. Long timelines, high investment, compounding returns.
- Demand capture: reaching prospects who already know they have a problem and are searching for solutions. Paid search, SEO, comparison content, review sites. Shorter timelines, direct ROI.
- Demand expansion: growing within existing customers and accounts. Customer marketing, account based marketing on existing logos, expansion campaigns. Highest ROI of any demand mode.
Most B2B companies overweight demand capture and underweight the other two. The result is short term pipeline that does not scale because you can only capture demand that someone else created.
How to balance the 3 modes
A balanced demand strategy at the growth stage typically allocates:
- 30% to 40% on demand creation (content, brand, thought leadership)
- 30% to 40% on demand capture (paid search, SEO, comparison content, ABM)
- 20% to 30% on demand expansion (customer marketing, expansion campaigns, advocacy)
The exact split depends on your stage and category. Early stage companies in new categories spend more on creation. Established companies in mature categories spend more on capture. Companies with strong customer bases benefit most from expansion focus.
Pipeline math
A useful demand strategy includes a basic pipeline model that ties activity to revenue:
- Goal: $20M in new ARR for next year
- Average deal size: $80K
- Required closed deals: 250
- Win rate: 25%
- Required sales qualified opportunities: 1,000
- Marketing source target (50%): 500 SQOs
- SQO to MQL ratio: 4:1
- Required MQLs: 2,000
This model becomes the basis for channel budgeting in layer 4. If the framework cannot support this kind of math, it is not finished.
Layer 4: Channel Mix
Channel mix is the layer where strategy becomes spending. The job is allocating budget across channels in a way that delivers the demand strategy.
The standard B2B channel portfolio
Most B2B companies in 2026 work with some combination of these channels:
| Channel | Demand mode | Time to results | Share of budget |
|---|---|---|---|
| Content marketing and SEO | Creation | 6 to 12 months | 15% to 25% |
| Paid search (PPC) | Capture | 1 to 3 months | 10% to 20% |
| Paid social (LinkedIn, etc) | Creation, capture | 1 to 3 months | 10% to 20% |
| Email and nurture | Capture, expansion | 1 to 2 months | 5% to 10% |
| Events and field marketing | Creation, capture | 3 to 6 months | 15% to 30% |
| ABM | Capture, expansion | 3 to 9 months | 10% to 20% |
| Partner and channel | Creation, expansion | 6 to 12 months | 5% to 15% |
| PR and analyst relations | Creation | 6 to 12 months | 5% to 10% |
The percentages above are starting points, not rules. The right mix depends on your ICP, positioning, demand model, and stage.
How to allocate budget
Start with the demand strategy from layer 3. If the strategy says 30% creation, 40% capture, 30% expansion, the channel mix should reflect that breakdown. Capture channels (PPC, comparison content) get the capture share. Creation channels (content, PR, brand events) get the creation share.
Then layer in stage realities. An early stage company with no brand cannot rely heavily on SEO because it takes 12 months to produce results. They need to overweight paid channels for short term pipeline while building organic foundations. An established company with strong brand can underweight paid because organic traffic and inbound interest already exist.
When to add or drop channels
The most useful question in channel decisions is: what would happen to pipeline if we cut this channel by 50% next month? If the answer is “not much,” the channel is not pulling its weight. If the answer is “we would lose 30% of pipeline,” it is a core channel and probably deserves more, not less, investment.
Most B2B teams keep too many channels active at low levels. A program with 10 channels each running at 60% of needed scale produces less pipeline than one with 5 channels running at 120% of needed scale. Concentration usually beats diversification.
Layer 5: Content Engine
The content engine produces the assets used across every channel. It is the operational layer that makes the strategy real.
The 4 content types
A complete B2B content engine produces 4 types of content:
- Awareness content: thought leadership, original research, opinion pieces. Built to attract and educate. Lives on the blog, in podcasts, in social, in PR.
- Education content: product agnostic guides, how to articles, definition pieces. Built to rank in search and answer prospect questions. Lives in SEO content and AI search results.
- Evaluation content: comparison pages, case studies, calculators, demos. Built to support active buyers. Lives on landing pages, in sales decks, in email nurture.
- Customer content: case studies, testimonials, ROI analyses, customer led content. Built to expand existing accounts and convert late stage prospects. Lives in customer marketing programs and bottom of funnel campaigns.
Most B2B companies overproduce awareness and education and underproduce evaluation and customer content. The result is lots of top of funnel traffic and weak conversion.
Content production rates
A working content engine produces specific volumes per quarter. Realistic targets at the growth stage:
- 12 to 16 long form pieces (2,000 to 4,000 words each)
- 6 to 10 evaluation assets (case studies, comparison pages, calculators)
- 4 to 6 original research pieces or data driven reports
- 1 to 2 customer videos or interactive case studies
- Daily social content across 1 to 2 platforms
- Weekly newsletter
Below these volumes, the channels that depend on content (SEO, social, email) starve. Above them, quality usually drops because production exceeds the team’s expert capacity.
The content team structure
A working content engine at the growth stage typically includes a content lead, 1 to 2 staff writers or producers, an SEO specialist, and a network of subject matter experts (often internal employees) who provide source material. This costs $400K to $700K a year fully loaded. Below that, the team is too small to maintain the volume and quality required.
Companies that try to run a serious content engine with one part time writer always fail. Content is not a side function. It is the production engine for every other channel.
Layer 6: Measurement
Measurement is the feedback loop that tells you whether the framework is working. Without it, the system runs blind.
The 5 metrics that matter
Most B2B marketing reports include 50 metrics, of which 5 actually matter:
- Pipeline sourced from marketing: total opportunity value created from marketing activity within the last 90 days. The headline metric.
- Pipeline influenced by marketing: opportunity value where marketing was a meaningful touchpoint, even if not the source. Usually 2x to 3x sourced pipeline.
- Cost per sales qualified opportunity: total marketing spend divided by SQOs created. The efficiency metric.
- Marketing contribution to revenue: percentage of closed revenue with marketing in the touch path. The strategic metric.
- Customer acquisition cost (CAC) and CAC payback: total cost to acquire a customer and how long it takes to break even. The unit economics metric.
These 5 metrics tell you whether the framework is producing business outcomes. Everything else is supporting data.
What to ignore
Common B2B marketing metrics that distract more than they help:
- Total website traffic (vanity, unless tied to qualified intent)
- MQL count (optimizes for volume, not quality)
- Social media engagement (rarely correlates with pipeline)
- Email open rates (broken metric since iOS 15)
- Cost per lead (incentivizes cheap leads, which are usually bad leads)
- Brand mentions (interesting, not actionable)
Reporting cadence
A useful measurement system runs at 3 cadences:
- Weekly: activity metrics for operational teams. Campaign performance, content publishing rate, pipeline movement.
- Monthly: outcome metrics for marketing leadership. SQO production, channel ROI, content engagement.
- Quarterly: strategic metrics for the executive team. Pipeline sourced, marketing contribution to revenue, CAC trends, ICP fit of acquired customers.
Reporting more frequently at higher levels produces noise. The CEO does not need a weekly report on email open rates. They need a quarterly view of pipeline and revenue contribution.
How to Build the Framework From Scratch
Most B2B companies do not have any of the 6 layers fully developed. Building the framework usually takes 8 to 12 weeks of dedicated work.
Weeks 1 to 3: ICP and positioning
Start with customer interviews and data analysis. Build the ICP. Draft positioning. Validate with sales and 5 customers. Write the positioning statement.
Weeks 4 to 6: Demand strategy and channel mix
Build the pipeline math. Decide demand mode allocation. Map channels to demand modes. Set initial budget allocation. Draft the campaign portfolio for the next 2 quarters.
Weeks 7 to 9: Content engine and measurement
Audit existing content against the new positioning. Identify gaps. Plan the content production calendar. Set up tracking. Define the 5 KPIs and reporting cadences.
Weeks 10 to 12: Document and roll out
Write the framework as a 5 page document. Present it to the executive team. Train the marketing team. Set up the systems to operate against it. Schedule the first quarterly review.
What slows it down
The 3 things that slow down framework projects:
- No customer access. If you cannot interview 10 to 15 customers in the first 4 weeks, the ICP and positioning will be guesses. Get sales help to unlock customer time.
- Internal politics around positioning. Executives often have strong opinions about positioning that are not based on customer evidence. Use customer research to settle these debates instead of internal debate.
- Trying to do it part time. A framework built in 2 hours a week takes 6 months. The same work done in 80% time takes 8 weeks. Concentrated effort wins.
How to Use the Framework Day to Day
A framework that lives in a slide deck does nothing. The point is to use it in daily decisions.
Campaign planning
Every new campaign should answer 4 framework questions before launch: which ICP segment does it target, which positioning element does it express, which demand mode does it serve, and which KPI does it move? Campaigns that cannot answer these questions are red flags.
Budget reviews
Quarterly budget reviews should compare actual channel spend to the framework allocation. If the framework says 30% of budget on demand creation but actual spend is 12%, that is a problem to discuss. Drift happens slowly and the framework is the discipline that catches it.
New hire onboarding
New marketing hires should read the framework on day 1. The 5 page document tells them who you sell to, why customers buy, how the demand model works, where the team spends, what content to produce, and how success is measured. Without this, every new hire takes 3 to 6 months to become productive.
Vendor evaluation
When evaluating new agencies, tools, or channels, the framework is the test. A vendor proposal that does not fit the framework is usually wrong, even if it sounds compelling. Discipline at this stage prevents most of the bad spending decisions in B2B marketing.
Recommendation
If you run B2B marketing for a company between $1M and $50M ARR in 2026, the highest leverage thing you can do this year is build a real marketing framework. Not a strategy deck. Not an OKR document. A working framework that connects ICP through measurement and lives on 5 pages.
Start with customer interviews and data analysis. Build the ICP. Draft and test positioning with 5 customers and the sales team. Build the demand model. Allocate channels. Plan the content engine. Set up measurement.
The total work is 8 to 12 weeks of focused effort. The return is a marketing organization that compounds instead of churning. Every campaign reinforces the same story. Every channel feeds the same pipeline. Every dollar of spend can be traced to a strategic choice.
For early stage companies, the framework removes the guessing that wastes most of the first marketing budget. For growth stage companies, it makes the difference between a marketing function that scales with revenue and one that becomes a cost center. For enterprise companies, it is the operating system that lets a 50 person team produce coherent output instead of 50 disconnected projects.
The framework is not glamorous work. It does not produce immediate pipeline. It does not generate impressive case studies in the first 90 days. What it does is set up the next 5 years of marketing to actually work. The companies that win in B2B over the long term are not the ones with the biggest budgets or the most channels. They are the ones with frameworks clear enough that every marketer on the team can explain who they serve, why customers buy, and how the work connects to revenue.
Build the framework. Use it daily. Revise it annually. Everything else gets easier.
