B2B Marketing Budget: Planning Guide for CMOs and Founders

Forrester research shows that 83% of B2B marketing leaders expect budget increases in 2026, and the average B2B firm now invests around 8% of revenue in marketing. Behind those headline numbers sits a more difficult reality: budget allocation, channel mix, and stage appropriate spending decide whether that investment compounds into pipeline or evaporates into activity that nobody can attribute to revenue.
This guide is written for CMOs, VPs of Marketing, and founders of B2B SaaS, cybersecurity, and industrial companies who need a defensible budget for 2026. Inside you will find benchmark data, a four step planning framework, the pipeline math that turns budget conversations into board ready scenarios, stage based allocation models, and the most common mistakes that erode marketing budgets every year.
How Much Should B2B Companies Spend on Marketing?
B2B companies should spend between 5% and 20% of revenue on marketing, with the exact percentage determined by company stage and industry. Mature B2B firms typically run 5% to 10% of revenue, while high growth tech companies often spend 10% to 20% as they invest ahead of revenue to build pipeline and market share.
Forrester places the average at around 8% of revenue across B2B. Gartner’s CMO Spend Survey reports 9.1% across industries in 2024. IDC research shows mature B2B companies running 5% to 10%, while high growth technology vendors run 10% to 20% during scaling phases. The variance is driven primarily by growth rate, ACV, and competitive intensity rather than by industry alone.
B2B Marketing Budget Benchmarks by Industry
| Industry | Marketing Spend (% of Revenue) | Notes |
|---|---|---|
| B2B SaaS | 8% to 15% | Higher for early stage and competitive categories |
| Cybersecurity | 12% to 20% | Long cycles and crowded category drive higher spend |
| Industrial and Manufacturing | 4% to 8% | Lower digital intensity, longer relationships |
| Professional Services | 3% to 6% | Reputation and referral driven |
| Fintech and Payments | 10% to 18% | Regulated, complex buying committees |
| Martech and Sales Tech | 12% to 20% | Hyper competitive, PLG motions raise CAC |
| Industrial SaaS | 8% to 14% | Hybrid of SaaS and industrial economics |
Cybersecurity sits at the top of the range because category competition is fierce, sales cycles run 6 to 18 months, and pipeline must be built through multiple touchpoints across a 6 to 10 person buying committee. Industrial and professional services run lower because relationships, channel partners, and referrals carry more weight than paid demand generation.
Budget Benchmarks by Company Stage
| Stage | Marketing Spend (% of Revenue) | Typical Budget |
|---|---|---|
| Pre seed (under $500K ARR) | 25%+ | $50K to $150K |
| Seed ($500K to $2M ARR) | 20% to 30% | $100K to $400K |
| Series A ($2M to $10M ARR) | 15% to 25% | $300K to $1.5M |
| Series B ($10M to $30M ARR) | 12% to 18% | $1.5M to $4M |
| Growth ($30M to $100M ARR) | 8% to 15% | $4M to $10M |
| Mature ($100M+ ARR) | 5% to 10% | $5M+ |
Early stage companies invest a higher percentage because pipeline must exist before revenue can scale. Mature companies invest a smaller percentage because absolute dollar amounts remain large and incremental spend produces diminishing returns. Stage matters more than industry average when setting expectations.
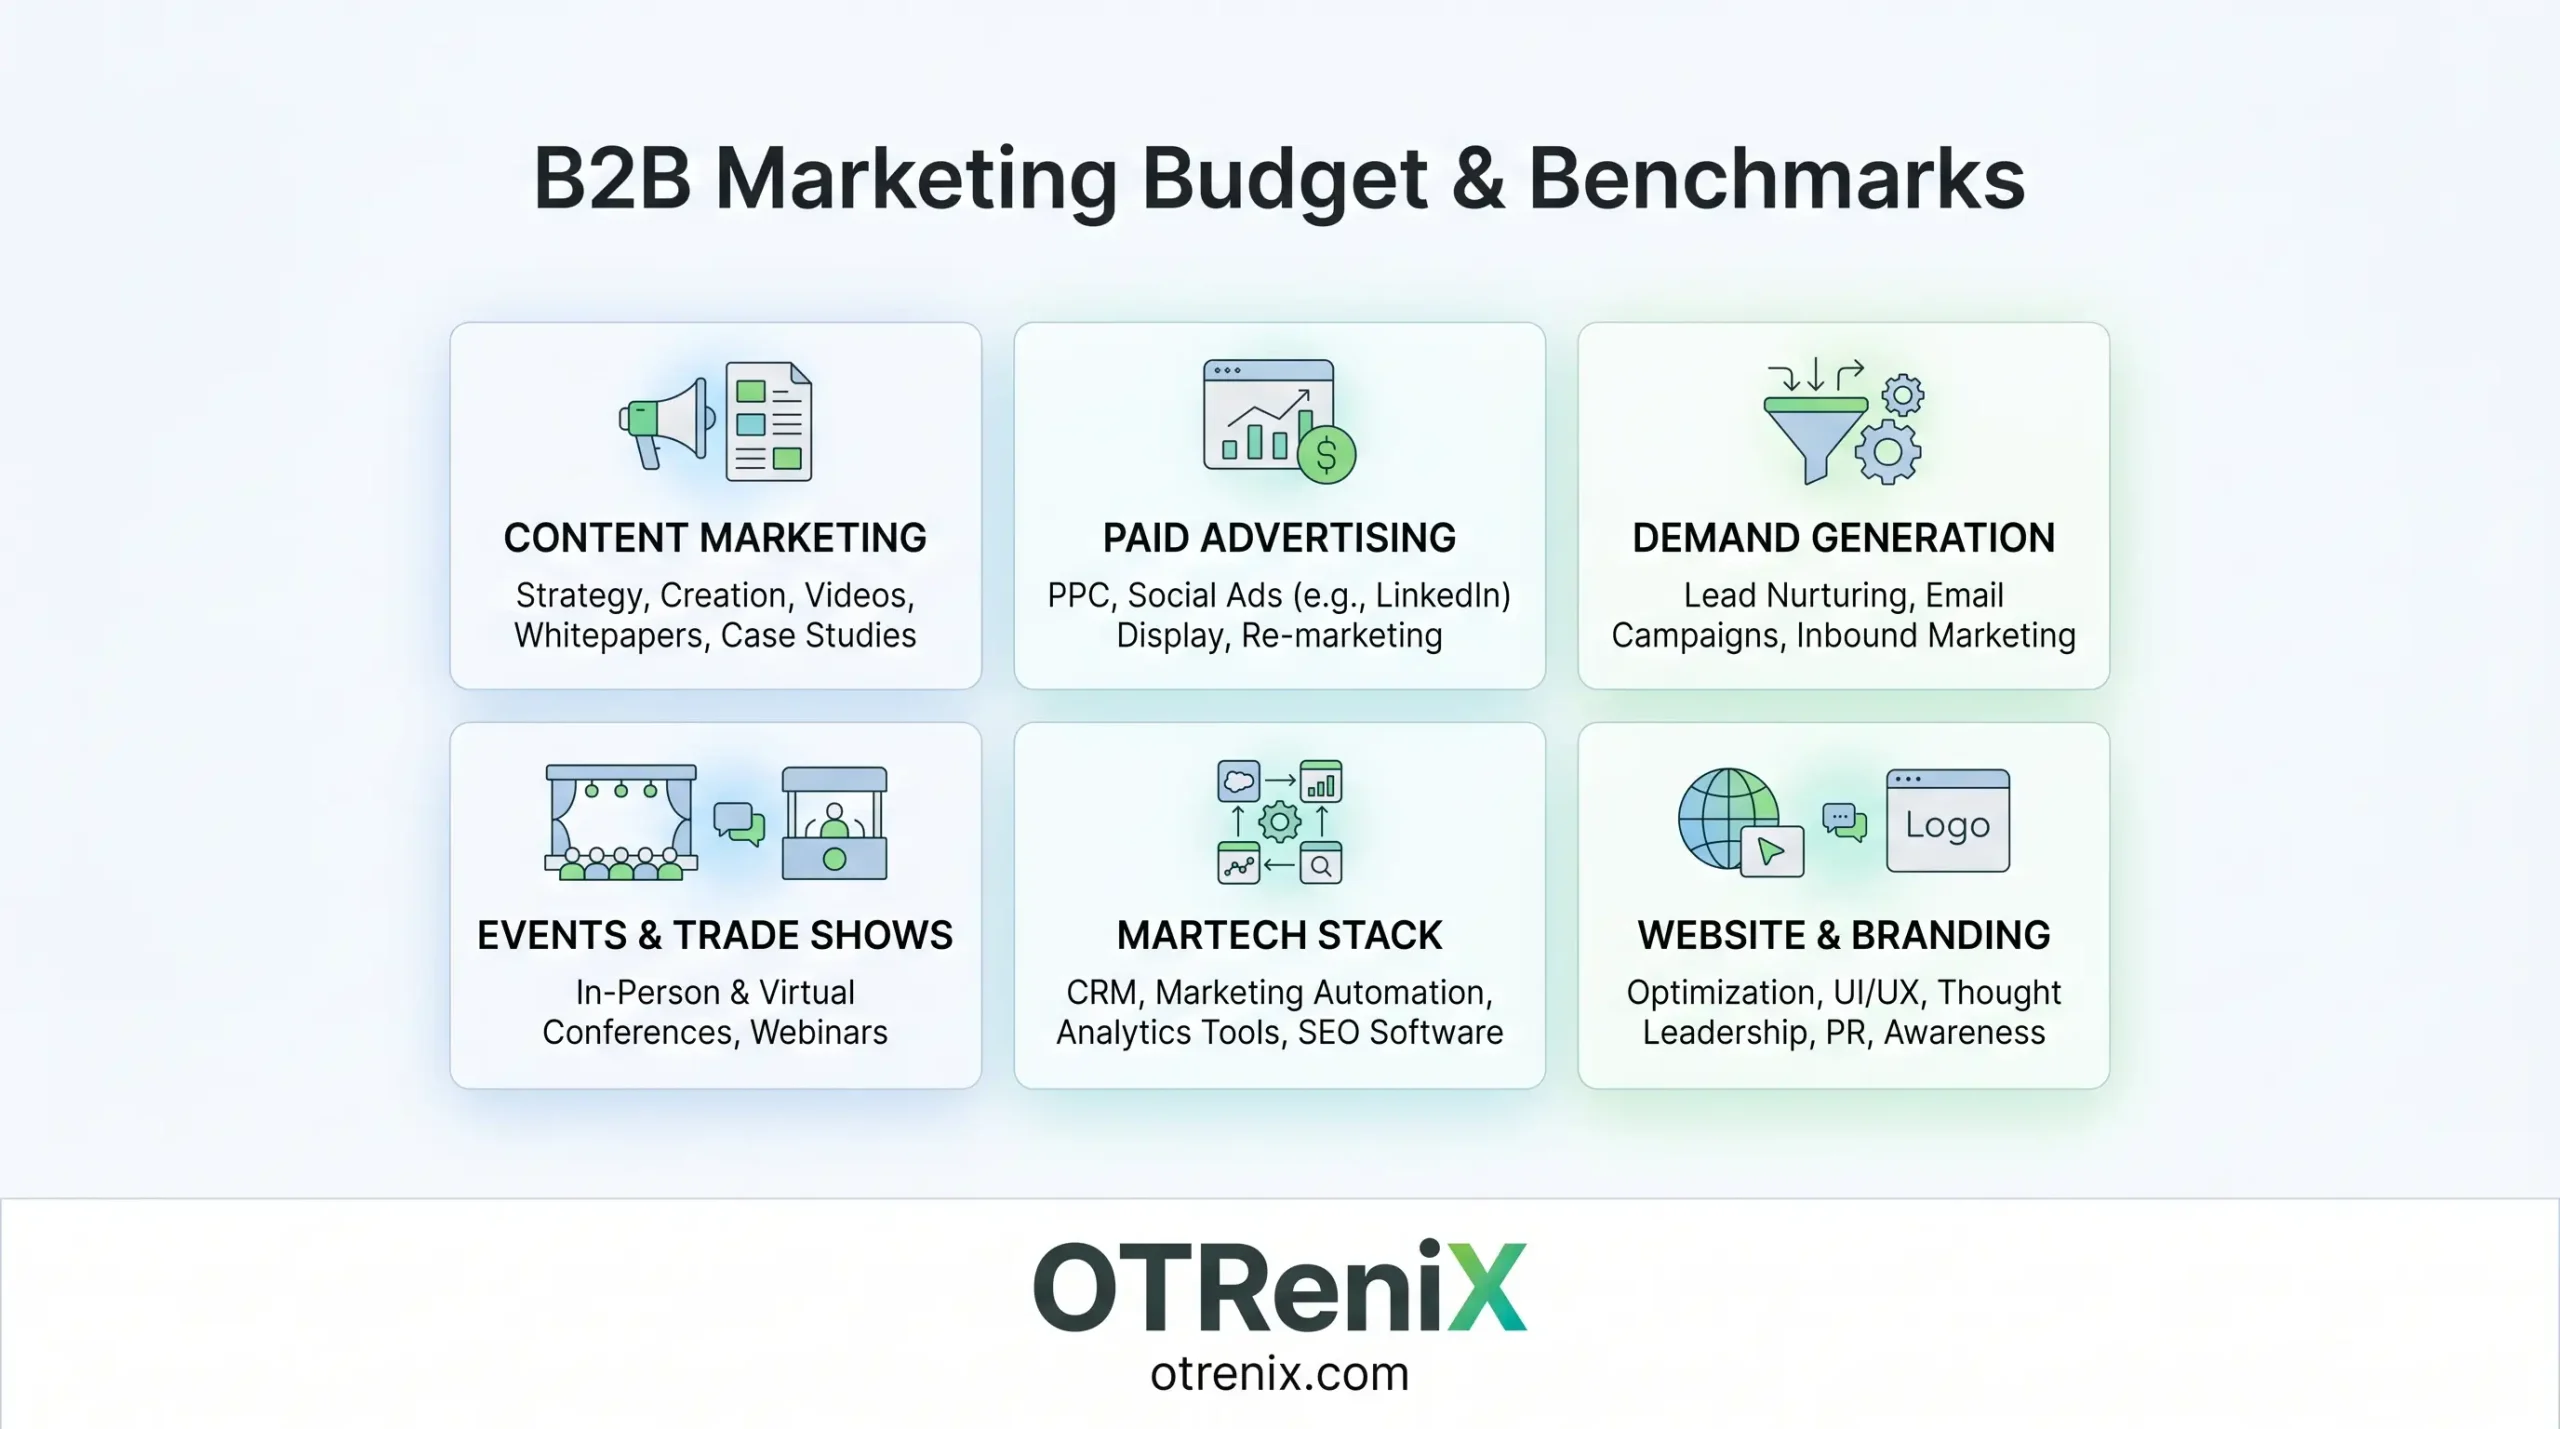
B2B Marketing Budget Allocation: Where Does the Money Go
The channels below represent the standard allocation model across mature B2B programs. Mix and weighting shift by stage, industry, and growth strategy.
Paid Advertising (Google, LinkedIn, ABM Ads)
Paid advertising budgets typically run from $1K per month for SMB programs to $50K+ per month for growth stage companies. The category includes Google Search Ads, LinkedIn Ads, programmatic display, retargeting, and ABM advertising platforms like 6sense, Demandbase, and RollWorks.
Benchmark allocation is 20% to 30% of total marketing budget at growth stage. The exact mix between search, social, and programmatic depends on ICP density across platforms and the maturity of organic channels.
Content Marketing and SEO
Content and SEO budgets run from $3K per month for boutique programs to $25K per month for mature content engines. The category includes blog production, whitepapers, case studies, ebooks, SEO retainers, and technical writing for product documentation.
Benchmark allocation is 15% to 25% of total budget. Content is a compounding asset: spending consistently over 12 to 18 months builds organic traffic that paid channels cannot replicate. Programs that under invest in content for two years rarely recover their organic position without significant additional investment.
AI Search Optimization (GEO and AEO)
Generative engine optimization (GEO) and answer engine optimization (AEO) budgets run from $2K to $15K per month. The category includes optimization for AI Overviews, citation tracking in ChatGPT and Perplexity, structured data implementation, and earned brand mentions in trusted sources that LLMs rely on.
This is a new line item that did not exist in most 2024 budgets but has become essential in 2026. Roughly 40% of B2B prospects now research through AI tools before reaching a Google search results page. A budget without GEO allocation guarantees invisibility at the start of the modern buying journey.
Marketing Technology Stack (MarTech)
MarTech budgets run from $500 per month for SMB stacks to $30K+ per month for enterprise stacks. The category includes CRM (Salesforce, HubSpot), marketing automation (Marketo, HubSpot, Pardot), attribution platforms (Dreamdata, HockeyStack, BizzaBo), intent data (6sense, Bombora, ZoomInfo), and analytics tools.
Gartner research shows MarTech at around 25% of total marketing budget for mature programs. This number has risen significantly over the past five years as buying committees demand more accurate attribution and intent based targeting.
Events and Field Marketing
Event budgets run from $5K for regional sponsorships to $100K+ per flagship event. The category includes industry conferences, trade show sponsorships, executive dinners, roadshows, hosted summits, and user conferences.
Benchmark allocation is 15% to 25% of total budget in event heavy industries like cybersecurity, fintech, and industrial. Event ROI is measured over 6 to 12 months and requires structured pre and post event execution to deliver pipeline.
Headcount and Agency Fees
Headcount and agency fees together represent the largest line item in most B2B marketing budgets. Gartner research shows roughly 25% allocated to labor (in house team salaries and benefits) and 23% allocated to agencies.
Fully loaded cost per in house marketer runs $120K to $180K including salary, benefits, equipment, and tools. Agency retainers run $5K to $50K per month depending on scope and seniority. The right mix depends on company stage, internal talent availability, and the speed at which capabilities need to ramp.
PR and Analyst Relations
PR and analyst relations budgets run from $5K per month for boutique support to $30K+ per month for enterprise programs. The category includes analyst briefings (Gartner, Forrester, IDC), Tier 1 media relations, contributed articles, awards programs, and industry recognition.
Benchmark allocation is 5% to 10% of total budget. PR and analyst relations are compounding investments that build credibility over multiple years. They produce limited short term pipeline but significant long term influence on enterprise buying decisions.
How to Build a B2B Marketing Budget: 4-Step Framework
The framework below converts budget planning from a top down guess into a defensible business case that survives executive scrutiny.
Step 1: Set Revenue Targets and Work Backwards
Start with two parallel calculations. The top down calculation uses industry and stage benchmarks (for example 15% of $5M ARR = $750K budget). The bottom up calculation uses pipeline math (see the worked example below) to derive the budget required to hit the revenue target.
The two numbers rarely match exactly, but together they produce a defensible range. If bottom up math demands $1.2M but the top down benchmark suggests $750K, the gap forces a strategic conversation: either secure more budget, lower the revenue target, or accept lower coverage of the funnel. Hiding this gap behind a single number guarantees disappointment at quarter end.
Step 2: Define Marketing Goals Tied to Revenue
Marketing goals must connect to revenue outcomes that the CFO and CEO recognize. Strong examples: “source $2M of pipeline by Q4,” “deliver 20% of new ARR from marketing sourced opportunities,” “reduce CAC by 15% while maintaining pipeline volume.”
Weak examples that fail under scrutiny: “increase brand awareness,” “grow website traffic by 30%,” “post 4 times per week on LinkedIn.” These metrics describe activity rather than outcomes. They do not survive a serious budget review.
Split goals across demand generation (new pipeline), demand capture (existing demand to revenue), brand (long term authority), and retention (customer expansion and renewal). Each goal type warrants different budget allocation and different success metrics.
Step 3: Allocate Across the Marketing Mix
The 70-20-10 rule provides a starting allocation framework. Allocate 70% of budget to proven channels that consistently deliver pipeline (paid search, content, ABM, events). Allocate 20% to new bets that have evidence but are not yet at scale (new content formats, new event categories, new ABM motions). Reserve 10% for pure experiments (emerging channels, new platforms, unproven tactics).
Companies that allocate 100% to proven channels lock themselves out of the next wave of growth. Companies that allocate too much to experiments produce activity but limited revenue. The 70-20-10 balance protects both current pipeline and future growth.
Step 4: Build the Business Case for Approval
The business case must include three scenarios: best case, expected case, and worst case. Best case assumes everything works and channels exceed benchmarks. Expected case uses benchmark conversion rates and channel performance. Worst case assumes 20% underperformance and a 10% to 15% budget cut requirement.
A worst case scenario built into the plan demonstrates that marketing leadership has thought through downside risk. CFOs respond well to this kind of planning. CMOs who present only best case numbers lose credibility when reality disappoints.
B2B Marketing Budget Math: Pipeline Calculation Example
The example below shows how to reverse engineer marketing budget from a revenue target. This math produces defensible numbers that survive board scrutiny.
A SaaS vendor targets $2M in new ARR from marketing in fiscal 2026. Average contract value (ACV) is $25K. The math runs as follows:
- Revenue target: $2M in new ARR
- Average deal size: $25K → 80 closed deals required
- Sales close rate from SQL to closed won: 25% → 320 SQLs required
- MQL to SQL conversion: 20% → 1,600 MQLs required
- Lead to MQL conversion: 25% → 6,400 leads required
- Benchmark CPL: $200 → required budget of $1,280,000
The resulting CAC of $16K per deal sits at 64% of ACV, which is within the healthy range of 30% to 80% for B2B SaaS. CAC payback at this level typically runs 18 to 24 months for SMB and mid market segments.
This calculation produces three immediate insights that any executive can verify. First, the budget is mathematically justified rather than guessed. Second, the assumptions are visible and can be challenged (close rate, conversion rates, CPL benchmark). Third, the relationship between budget and revenue is explicit, which makes the budget defensible during cost cutting conversations.
A worked example like this should sit at the front of every annual budget presentation. The detail signals competence and forces the executive team into substantive conversations about which assumptions need to change versus which are realistic.
B2B Marketing Budget by Company Stage
Different stages require fundamentally different budget structures and team configurations. Forcing a Series A budget model onto a Series B company guarantees underperformance.
Pre Seed and Seed Stage ($0 to $2M ARR)
Total budget: $50K to $300K per year.
Allocation: 60% content and SEO/GEO, 20% founder led ABM, 10% events, 10% tools.
Team: fractional CMO plus 2 to 3 freelancers or one or two agency retainers covering specific functions (SEO, content production, paid).
Skip: large scale paid media, broad PR programs, full analyst relations programs. These investments require pipeline volume that early stage companies cannot yet support.
Focus: establish messaging, build the content foundation, create the GEO and SEO assets that will compound over the next 24 months, and run founder led outreach to validate ICP and refine positioning.
Series A ($2M to $10M ARR)
Total budget: $300K to $1.5M per year.
Allocation: 30% paid and ABM, 25% content and SEO/GEO, 15% events, 15% headcount, 10% tools, 5% PR.
Team: VP Marketing plus 2 to 3 specialists (demand gen, content, product marketing) supported by agency retainers for SEO, paid media, and PR.
Add: demand generation infrastructure, attribution stack, ABM platform, intent data subscription, and structured event presence at 4 to 6 industry conferences per year.
This is the stage where marketing infrastructure investments pay back fastest. Companies that build attribution and ABM capability at Series A scale much more efficiently at Series B and beyond.
Series B and Growth ($10M to $50M ARR)
Total budget: $1.5M to $7M per year.
Allocation: full funnel coverage including paid, content, ABM, events, partnerships, customer marketing, and brand.
Team: CMO plus 8 to 15 marketers across demand gen, product marketing, content, brand, customer marketing, partner marketing, and operations, supported by specialized agencies for high leverage functions.
Add: analyst relations programs, programmatic ABM at scale, customer expansion marketing, partner marketing programs, and regional expansion if international growth is in scope.
Enterprise ($50M+ ARR)
Total budget: $5M+ per year, typically running 6% to 10% of revenue.
Allocation: brand, demand gen, ABM, global expansion, customer marketing, and partner marketing in full coordination.
Team: 20+ marketers organized into specialized functions, supported by multiple agencies and in house creative capability.
Add: dedicated customer marketing teams, partner marketing programs, regional marketing teams, in house creative studios, and programmatic operations capabilities.
In House vs Agency vs Hybrid: Budget Implications
The build versus buy decision shapes both cost structure and operational flexibility. Each model has trade offs that vary by stage.
All In House
Pros: deep brand expertise, full control, accumulated product knowledge, faster cross functional collaboration with sales and product.
Cons: long hiring cycles, fixed cost structure, gaps in specialized expertise, limited ability to scale up or down quickly.
Cost profile: 100% headcount plus benefits plus tools. Fully loaded cost per marketer runs $120K to $180K per year, with senior leadership running $200K to $400K+.
Best fit: enterprise and mature companies with stable budgets, strong brand requirements, and predictable growth rates.
All Agency
Pros: fast ramp time, specialist expertise on demand, flexibility to scale up or down, exposure to cross client learning.
Cons: less brand depth, retainer minimums, coordination overhead across multiple agencies, weaker integration with sales and product teams.
Cost profile: $5K to $50K per month per agency retainer depending on scope.
Best fit: pre seed, seed, and early Series A companies that need capability quickly and cannot yet justify or attract senior in house talent.
Hybrid (Most Common at Series A and Beyond)
Pros: in house leadership ensures brand and strategy continuity while agency execution adds specialist capability and flexibility.
Cons: requires strong vendor management discipline, clear scope boundaries, and consistent communication.
Cost profile: typically 60% in house headcount and 40% agency for Series A and Series B companies. At growth and enterprise stages the ratio often shifts toward 70% in house and 30% agency for highly specialized work like analyst relations, creative production, and emerging channels.
Best fit: companies with $5M+ ARR that need both strategic depth and execution flexibility.
Common B2B Marketing Budget Mistakes
The errors below appear in nearly every underperforming B2B marketing budget.
Treating Marketing as a Cost Center, Not Investment
The framing problem starts with how marketing presents itself to the CFO. Budget reviews that focus on cost reductions and efficiency gains position marketing as an expense to be minimized. Budget reviews that focus on revenue contribution, CAC payback, and LTV impact position marketing as an investment to be optimized.
Reframe every budget conversation around revenue impact. “We need $1.2M to deliver $2M in new pipeline” wins more support than “We need $1.2M to cover our marketing operations.”
Underfunding Long Cycle Initiatives
Content, SEO, GEO, brand, and analyst relations are compounding assets with a 6 to 12 month lag. They produce limited short term pipeline but significant long term competitive advantage. When budgets tighten, these are often the first line items cut because their short term impact is hardest to measure.
The cost of cutting compounding assets shows up 12 to 18 months later as a pipeline gap that paid channels cannot fill at any price. By then the CFO who approved the cuts has long forgotten the cost saving win.
Ignoring AI Search and GEO Allocation
Around 40% of B2B prospects now research vendors through ChatGPT, Perplexity, and AI Overviews before reaching a traditional search results page. A 2026 budget without a dedicated GEO line item guarantees invisibility at the start of the modern buying journey.
GEO requires modest investment ($2K to $15K per month at most companies) but the return is significant. Vendors who establish GEO presence now will lock in citation patterns that compound over the next 24 months. Vendors who wait will find catching up significantly more expensive.
Over Indexing on Paid Acquisition
Paid acquisition scales until it hits diminishing returns, usually when paid represents more than 40% of total marketing budget. Beyond that threshold, additional paid spend produces declining incremental pipeline and rising CPL.
Healthy mix for sustainable growth: paid below 40% of budget, organic and content building the foundation, and ABM and events filling the gap for high value accounts. Companies that depend on paid for the majority of their pipeline cannot survive the CPL increases that occur during competitive market cycles.
No Budget for Testing and Experimentation
A 10% experimentation reserve is essential. The reserve funds new channels, new content formats, new event categories, and emerging platforms before they become competitive necessities.
Companies that allocate 100% of budget to “what worked last year” miss the next wave of growth and watch competitors capture share through channels they ignored. The compounding effect of consistent experimentation produces nonlinear returns over 3 to 5 years.
How to Defend Your B2B Marketing Budget
Budget defense is a year round activity, not a quarterly exercise. The practices below build credibility before any budget review begins.
Tie Every Line Item to Revenue Impact
Every line item in the budget should connect to a revenue outcome. Paid search budget connects to MQL volume which connects to pipeline. Content budget connects to organic traffic which connects to MQL volume. Events budget connects to opportunity creation which connects to closed won revenue.
When the CFO asks why a specific line item exists, the answer must reference revenue. “Brand awareness” is not a revenue connection. “Influences 30% of late stage deals based on attribution data” is.
Show Forecast Scenarios
Present three scenarios at every budget review: best case, expected case, and worst case. Build the worst case to assume a 10% to 20% budget reduction. This signals to executive leadership that the team has thought through downside risk and has a plan to maintain pipeline if cuts become necessary.
Worst case planning also accelerates faster decisions during economic downturns. Teams that already know what to cut first respond faster than teams who must scramble to identify reductions under pressure.
Report Marketing Performance Monthly to CFO
Monthly performance reporting to the CFO builds trust before any budget conversation. Quarterly reports leave too much room for surprises. Monthly reports establish a track record of accurate forecasting, transparent reporting on misses, and consistent connection between spending and outcomes.
The marketing team that has shared 12 months of monthly performance data with the CFO will have a far easier budget review than the team that surfaces only at planning time with optimistic projections.
Key Takeaways
B2B marketing budget planning is one of the highest leverage activities a CMO performs each year. The principles below summarize the most important conclusions from this playbook.
- Allocate 5% to 10% of revenue for mature B2B companies and 10% to 20% for high growth ones. Cybersecurity and SaaS run higher (12% to 20% at scale). Industrial and professional services run lower (4% to 7%). Stage matters more than industry average when setting expectations.
- Build your budget bottom up from pipeline math, not just top down from revenue percentages. Reverse engineer from revenue target to deals to SQLs to MQLs to leads to cost per lead. This produces defensible numbers that survive any CFO review.
- Add a GEO and AI search line item in 2026. Around 40% of B2B prospects now research vendors through ChatGPT, Perplexity, and AI Overviews before reaching Google. A 2026 budget without a GEO allocation guarantees invisibility at the start of the buying journey.
- Reserve 10% of budget for experimentation. This is the compounding edge over competitors locked into “what worked last year.” New channels, new content formats, and emerging platforms become category defining before incumbents catch up.
- Do not cut content, SEO, or brand first when budgets tighten. These are compounding assets with a 6 to 12 month lag. Cutting them shows up as a pipeline gap in 12 to 18 months, long after the CFO has forgotten the cost saving win.
- Watch CAC payback, not cost per lead. Low CPL with high CAC means the program is paying for volume rather than pipeline. Healthy B2B CAC payback: under 18 months for SMB, under 24 months for mid market, under 30 months for enterprise.
- Match the engagement model to company stage. Pre seed needs fractional CMO plus freelancers. Series A needs in house leadership plus agency execution. Growth stage needs hybrid teams. Going all in house too early kills speed. Going all agency too late kills brand depth and institutional knowledge.
The companies that win at B2B marketing treat budget planning as a strategic discipline that compounds over multiple years. Build the financial math, set the right channel mix, defend the long term assets that produce pipeline a year from now, and report performance with the rigor that earns executive trust. Done consistently, the marketing budget stops being a defensive conversation each year and becomes a growth lever that the entire executive team supports.